
In this article, we will explore AWS CloudWatch—a versatile monitoring and management tool that we recommend for healthcare development projects. CloudWatch offers real-time visibility into infrastructure and applications, enabling timely actions to maintain performance and reliability.
This is especially important in healthcare systems, which handle sensitive patient data, provide continuous monitoring, and run critical applications where even minor disruptions can impact clinical workflows and data availability. Monitoring in healthcare systems is essential because these environments operate in real time, leaving no room for delays in detection or response. This makes healthcare system monitoring and alerting a critical component of reliable system architecture.
The Importance of Monitoring and Alerts in Healthcare
Healthcare systems operate in real-time environments where even minor disruptions can directly impact clinical workflows and operational efficiency.
In practice, failures rarely look like a complete system outage. Instead, they appear as small but critical issues:
- API downtime results in no access to Electronic Health Records (EHR), delaying diagnosis and treatment decisions
- Delayed alerts mean abnormal patient vitals, such as heart rate or oxygen levels, are not escalated in time
- Failed integrations prevent lab results or imaging data from reaching the care team
Even when systems remain technically operational, these issues can silently disrupt care delivery. Monitoring and alerting systems are essential because they detect these failures early and enable fast response. Without proper visibility, teams often discover issues only after they start affecting users or patients.
Even a short delay in alert delivery (for example, 30–60 seconds) can impact time-sensitive workflows such as ICU monitoring or emergency response systems, where reaction time is critical.
Robust monitoring ensures:
- Continuous access to critical systems such as EHR, remote patient monitoring, and telemedicine platforms
- Early detection of anomalies before they escalate into larger failures
- Reliable data flow between systems, especially in integration-heavy environments
In healthcare, monitoring is not just about infrastructure stability. It is about maintaining the integrity of clinical workflows, where timing, accuracy, and data availability directly influence outcomes.
Enhancing Patient Safety with AWS CloudWatch
Healthcare system monitoring and alerting play a critical role in maintaining patient safety by ensuring that data is available, accurate, and delivered on time. In practice, this requires tracking specific system behaviors and reacting to failures immediately.
Electronic Health Records (EHR)
For EHR systems, continuous access to patient data depends on the stability of backend services and databases.
- What is being monitored: API latency, database response time, error rates
- Type of alert: Threshold-based alerts on latency spikes and error rate increases
- Trigger examples: API response time exceeds defined limits, database queries slow down, or error rates rise above normal levels
Monitoring these metrics ensures uninterrupted access to patient records and prevents delays in clinical decision-making.
Clinical Decision Support Systems (CDSS)
CDSS platforms rely on timely processing of clinical rules and seamless data exchange with external systems.
- What is being monitored: Rule processing time, integration status with lab systems, system execution delays
- Type of alert: Event-based and latency alerts for delayed or failed processing
- Trigger examples: Delayed execution of clinical rules, failed API calls to lab systems, or missing input data
Alerts can be triggered when clinical rules are not processed on time or when integrations fail, reducing the risk of missed recommendations or incorrect treatment decisions.
Remote Patient Monitoring (RPM)
RPM systems depend on continuous data flow from medical devices and real-time analysis of patient vitals.
- What is being monitored: Device connectivity, data ingestion rate, abnormal vital thresholds
- Type of alert: Real-time alerts for missing data or abnormal patient metrics
- Trigger examples: Device disconnects, drop in data transmission frequency, or vitals exceeding predefined thresholds
These alerts ensure that care teams are immediately notified of both technical issues and potential patient risks, enabling faster intervention.
Cost Optimization and Efficiency with AWS CloudWatch
Cloud costs can grow rapidly in healthcare environments if left unmanaged. In AWS CloudWatch healthcare environments, cost optimization depends on visibility into specific cost drivers rather than general system performance.
In practice, this means identifying where costs are generated and optimizing system behavior based on real usage patterns.
The most common cost drivers in AWS-based healthcare systems include:
- Lambda execution duration — longer execution times directly increase compute costs
- Invocation count — high-frequency triggers (especially in event-driven systems) can significantly increase total usage
- Log volume — excessive or unstructured logging leads to high storage and ingestion costs
- Metrics storage — large volumes of custom metrics, especially with high granularity, can increase monitoring expenses
CloudWatch provides detailed insights into these areas, allowing teams to track usage patterns and make targeted optimizations.
Instead of broadly analyzing system behavior, teams can identify exactly where costs are generated and take action, such as reducing Lambda execution time, limiting unnecessary invocations, or optimizing logging strategies.
Example from practice
For example, we discovered that certain AWS Lambda functions in one of our healthcare projects were consuming up to $300 per month. By analyzing CloudWatch metrics, we optimized the functions and reduced costs to just $20–30—resulting in savings of nearly $1,000.
The biggest cost drivers we typically see are inefficient Lambda execution time, excessive logging, and unoptimized retry mechanisms.
What is AWS CloudWatch?
Amazon CloudWatch is a monitoring and observability service designed to provide real-time visibility into applications, infrastructure, and system behavior.
In healthcare systems, where multiple services, integrations, and data flows operate simultaneously, CloudWatch acts as a centralized layer that collects and correlates operational data across the entire system.
CloudWatch operates across three main layers — metrics, logs, and events — which together enable full observability of distributed systems.
It aggregates three core types of data:
- Metrics — performance indicators such as latency, CPU usage, error rates, and request volume
- Logs — detailed records of system events, application behavior, and errors
- Events — system changes, triggers, and automated responses
This unified view allows teams to detect issues faster, understand their root cause, and respond before they impact clinical workflows.
CloudWatch is not just a monitoring tool but an operational control layer that enables:
- Real-time system visibility across distributed healthcare applications
- Proactive issue detection through thresholds and anomaly detection
- Automated responses to system events (e.g., scaling, restarts, notifications)
In complex healthcare environments, where systems include EHR platforms, IoT devices, APIs, and third-party integrations, this level of visibility is essential to maintain system reliability and data integrity. As a result, CloudWatch becomes a key component of healthcare observability in modern cloud-based systems.
Key Features of CloudWatch for Healthcare
CloudWatch provides a set of core features that support healthcare observability, fast incident response, and operational control in healthcare systems.
Automated Alerts and Notifications
What it does:
CloudWatch triggers alerts when predefined thresholds or anomaly patterns are detected, notifying teams via integrated communication channels.
Why it matters in healthcare:
Enables immediate response to critical issues such as API failures, high latency, or unauthorized access attempts before they impact clinical workflows or patient care.
Example:
For example, an alert can be triggered when error rates exceed a defined threshold or when unauthorized access attempts are detected, allowing teams to respond before security or data integrity is compromised.
Integration with AWS Lambda
What it does:
CloudWatch integrates with AWS Lambda to trigger automated actions in response to system events, such as retrying failed processes, restarting services, or scaling infrastructure.
Why it matters in healthcare:
Supports automated incident response, allowing systems to self-heal without manual intervention. This is especially important in time-sensitive environments where delays in response can disrupt care delivery.
Example:
For example, if a data processing function fails, CloudWatch can automatically trigger a retry or restart mechanism, ensuring that critical patient data is processed without manual intervention.
AI-Driven Anomaly Detection
What it does:
CloudWatch uses machine learning models to detect unusual patterns in system behavior, even when no fixed thresholds are defined.
Why it matters in healthcare:
Helps detect abnormal system behavior, such as unexpected spikes in API usage or drops in data from medical devices, enabling proactive issue resolution before it impacts patient care.
Example:
For example, a sudden drop in incoming data from connected medical devices can signal device failure or connectivity issues, allowing teams to investigate before patient monitoring is affected.
How AWS CloudWatch Works
CloudWatch operates as a continuous monitoring cycle that collects, processes, and acts on system data in real time. This process can be represented as a loop consisting of four key stages:
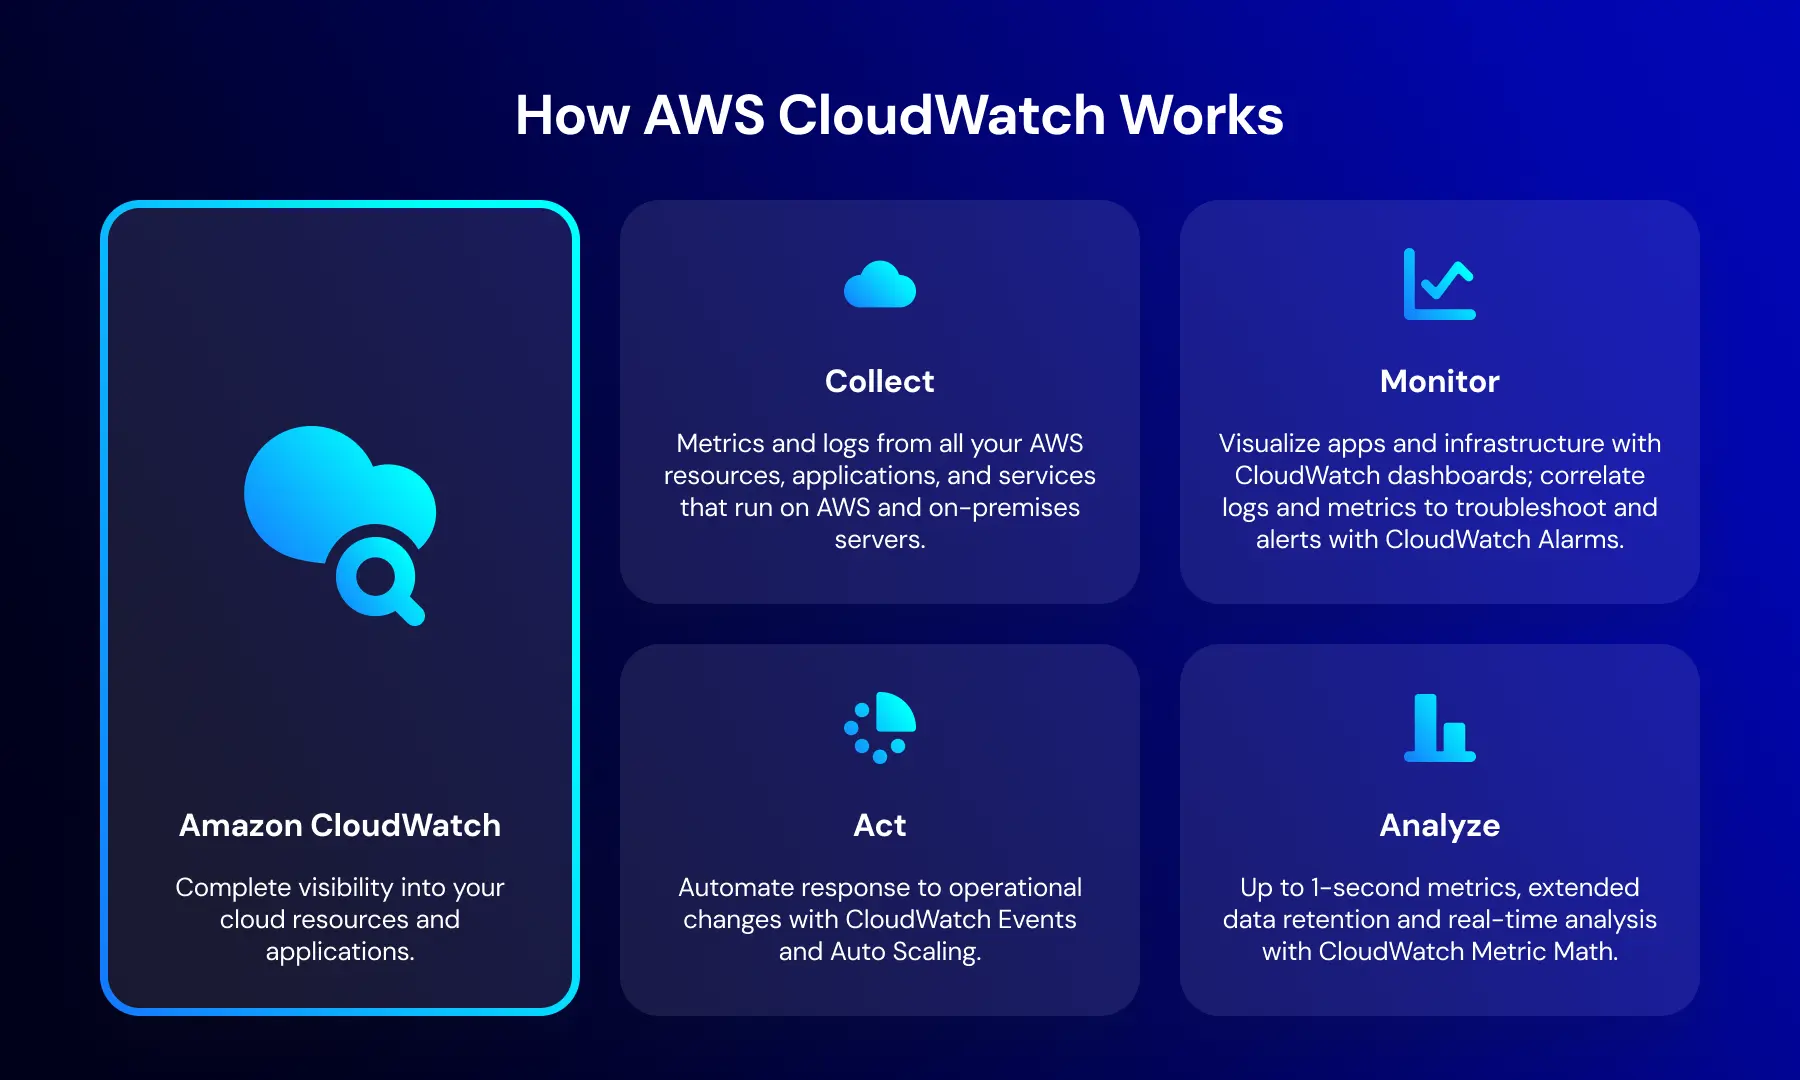
Collect
CloudWatch gathers metrics and logs from AWS resources, applications, and connected systems, including servers, APIs, databases, and IoT devices.
Monitor
The collected data is visualized through dashboards, allowing teams to track system behavior, correlate metrics and logs, and identify performance issues or anomalies.
Act
When predefined thresholds are exceeded or unusual patterns are detected, CloudWatch triggers alerts or automated responses, such as scaling infrastructure or restarting services.
Analyze
CloudWatch enables deeper analysis of system behavior using historical data, high-resolution metrics, and tools like Metric Math to identify trends and optimize performance.
According to this flow, CloudWatch enables a fully automated monitoring process where data is continuously collected, analyzed, and used to trigger actions.
In healthcare systems, this cycle is critical because it enables automatic detection of anomalies, such as abnormal API latency or failures in data processing. These issues can immediately trigger alerts and automated scaling or recovery actions without manual intervention, ensuring that clinical systems remain responsive and reliable. This approach is essential for effective monitoring in healthcare systems and real-time alerting, where immediate response is required.
Case Study: AWS CloudWatch in a Healthcare Setting
Let’s examine how AWS CloudWatch for healthcare projects was implemented in one of our healthcare projects — a remote patient monitoring platform used by clinics and patients.
Project Context
- Built on AWS infrastructure
- More than 500 AWS Lambda functions
- Two platforms: web (for practitioners) and mobile (for patients)
- 20,000+ users across platforms
- 500+ log groups and 1,400+ metrics monitored
This was a high-load, real-time system with continuous data processing, where patient data, device signals, and system events were processed without interruption.
Data Collection and Visualization
We collect large volumes of logs, metrics, and events from multiple AWS services, including:
- API Gateway — request rates, latency, error responses
- AWS Lambda — execution duration, invocation count, error rates
- DynamoDB — read/write capacity usage, throttling events
CloudWatch consolidates this data into a centralized dashboard, providing real-time visibility into system behavior.
This allows teams to quickly identify:
- performance bottlenecks
- failing services
- abnormal system behavior
and trace issues back to their exact source.
Alert Configuration, Metrics, and Events
We configured alerts based on critical system thresholds and real-time events.
Examples of alerts include:
- Latency alerts triggered when API response time exceeds defined thresholds (e.g., >300–500 ms)
- Error rate alerts activated when error rates exceed acceptable levels (e.g., >2–5%)
- Unauthorized access alerts triggered on suspicious authentication attempts or unusual access patterns
These alerts can be defined in code or configured directly in CloudWatch.
Metrics and events are also used to automate system behavior, such as:
- scaling infrastructure under increased load
- triggering notifications for operational teams
- initiating recovery actions for failed processes
Impact
With this setup, the system achieved:
- Faster detection and resolution of performance issues
- Reduced downtime in patient-facing services
- Improved reliability of real-time data processing
- Better control over infrastructure behavior under load
Most importantly, the monitoring system ensured that critical healthcare workflows remained stable and responsive, even under high load and continuous data streams.
Examples of CloudWatch Usage in Our Healthcare Project
Let’s take a closer look at how CloudWatch functions within the healthcare project we introduced earlier.
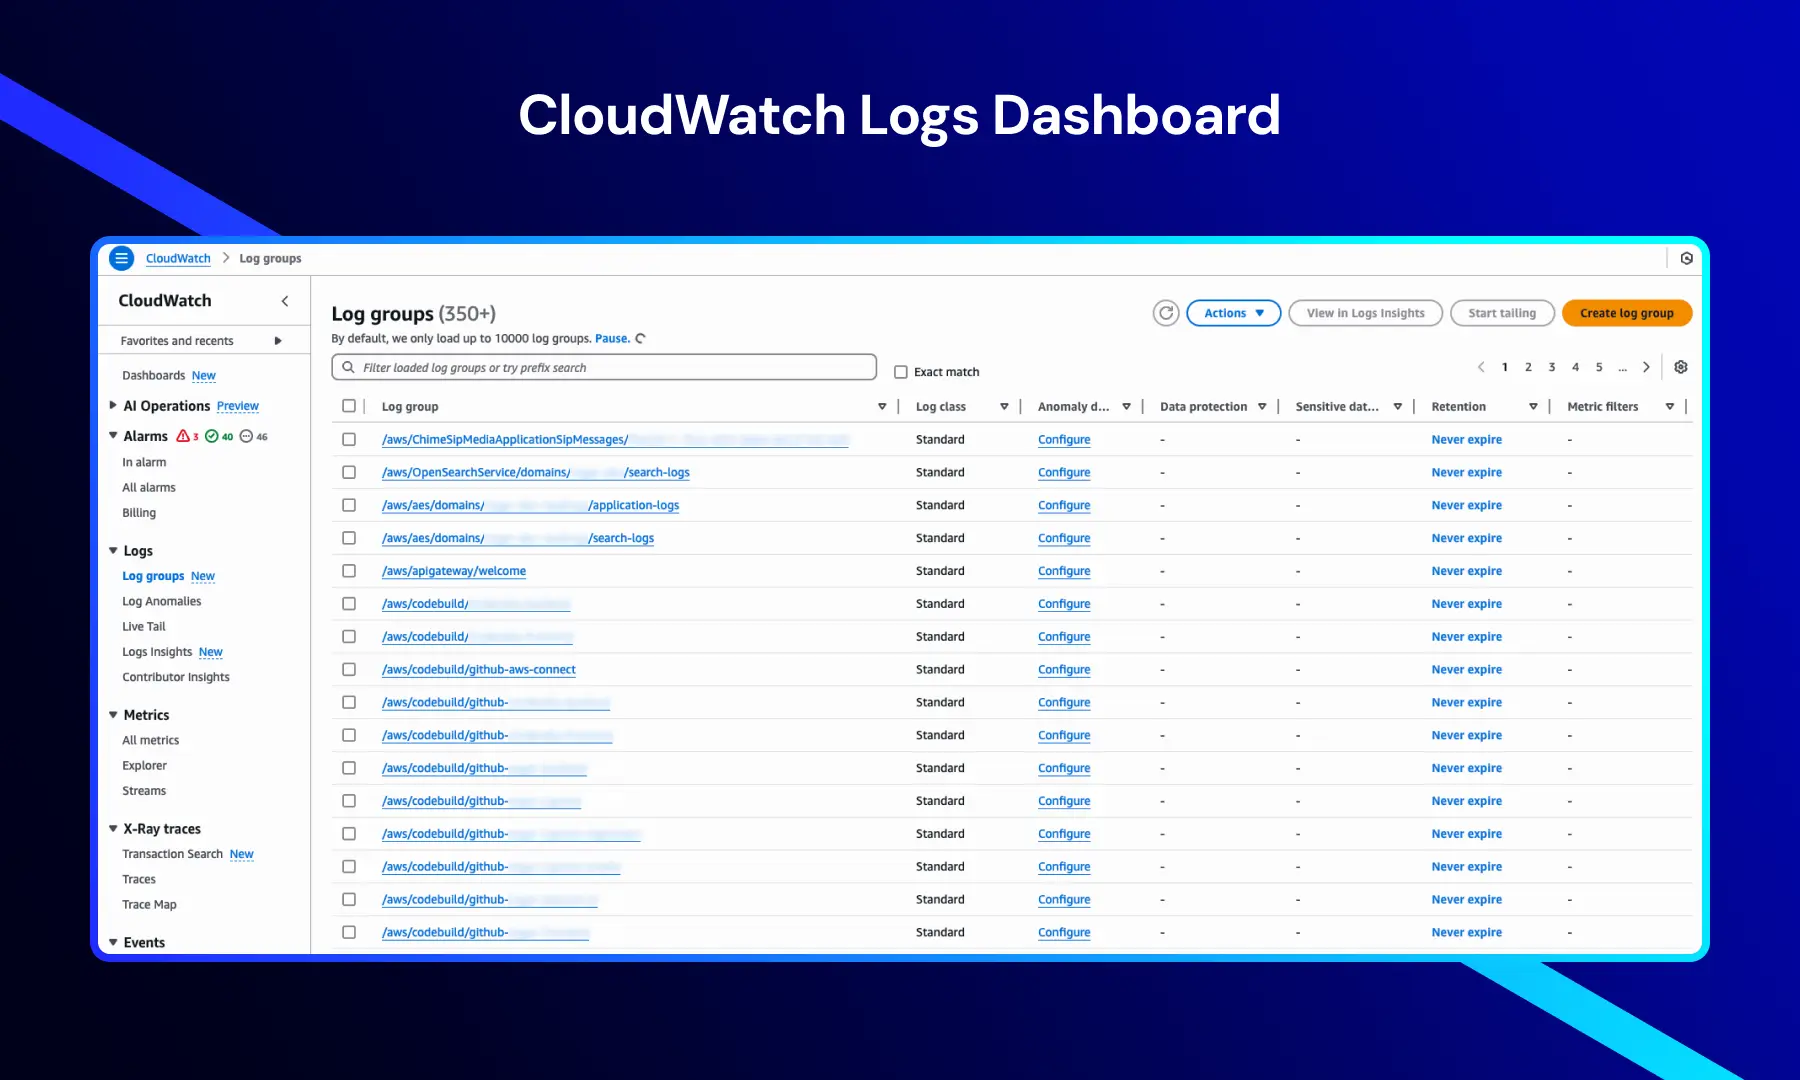
CloudWatch Logs Dashboard
This view displays log groups that organize and store logs from different AWS services and resources.
It provides key information such as:
- Log group names — logs generated by applications, infrastructure, and AWS services
- Log class — typically set to Standard for default log handling
- Retention settings — often configured to “Never expire” for long-term analysis
- Anomaly detection configuration — enabling identification of unusual log patterns
Navigation options such as Alarms, Metrics, X-Ray traces, and Events provide access to the full monitoring and analysis capabilities of CloudWatch.
This view is essential for centralized log management and efficient troubleshooting across distributed systems.
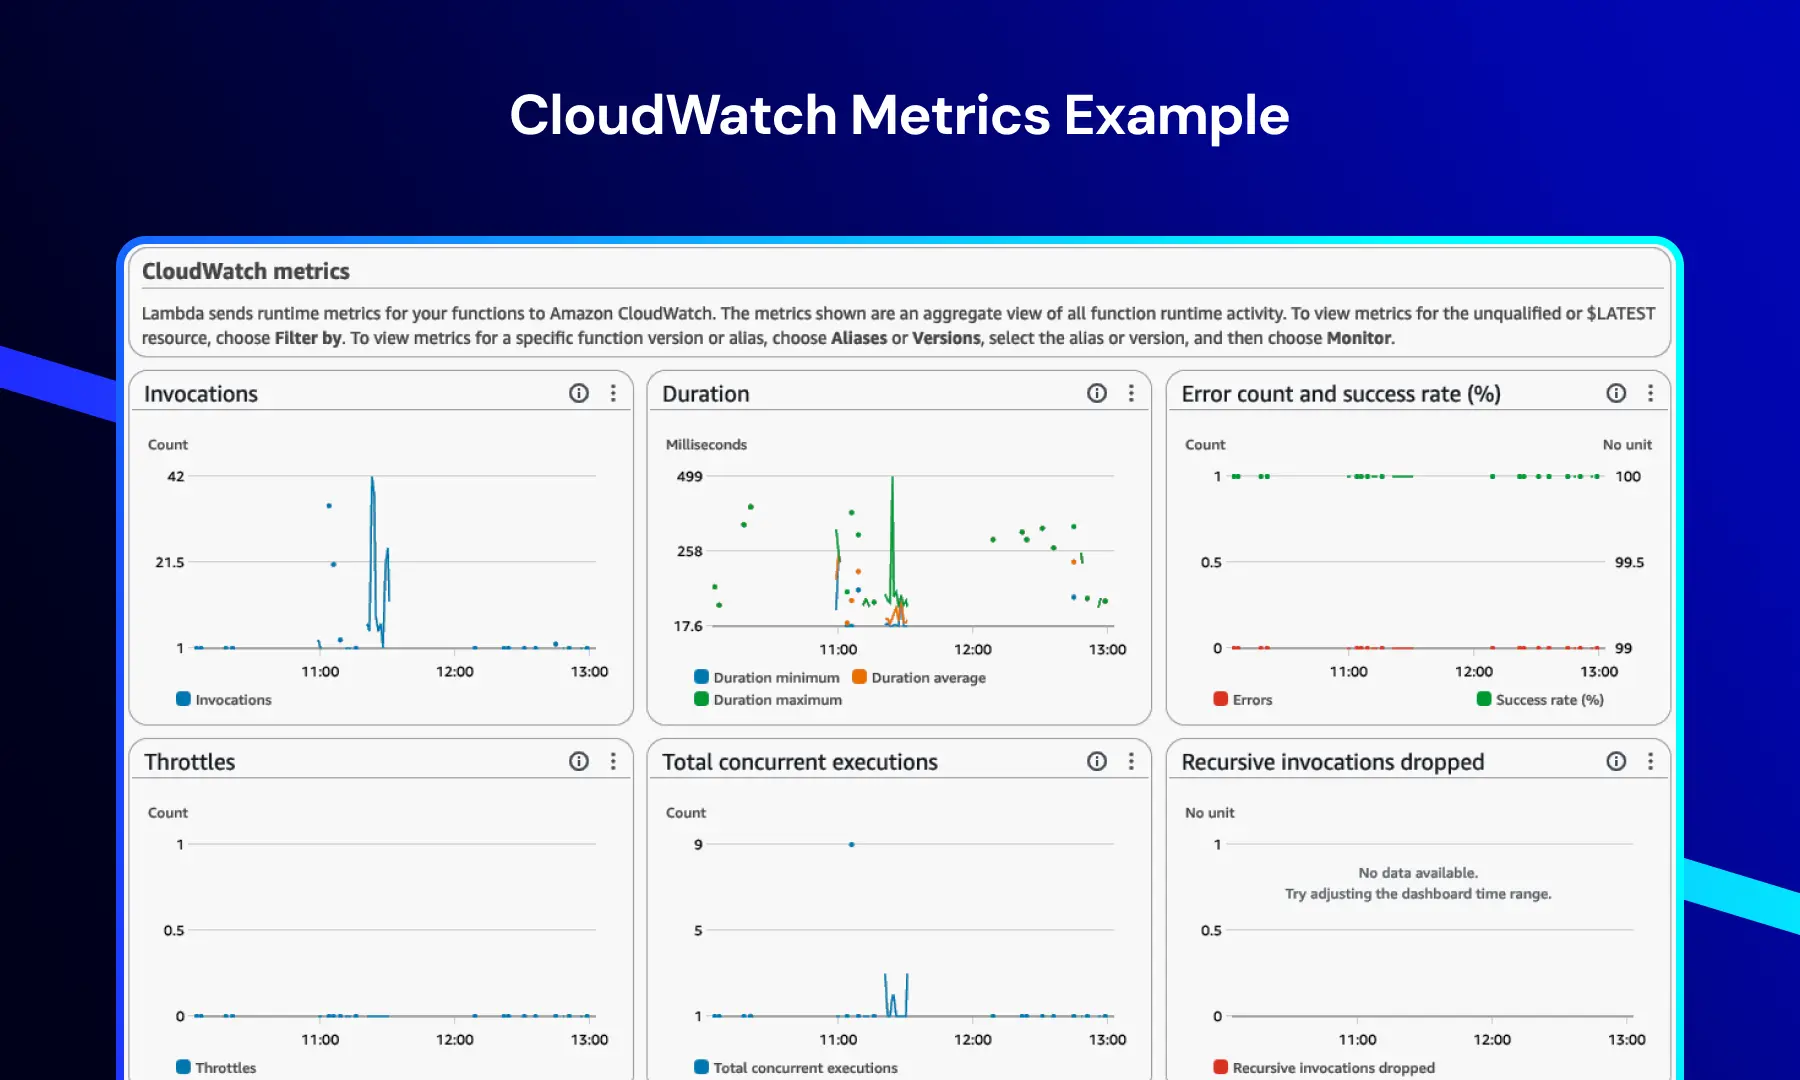
CloudWatch Metrics
This dashboard provides real-time insights into system and application performance.
It typically includes:
- Function invocations
- Execution duration
- Error rates
- Throttling events
This allows teams to monitor performance trends, detect bottlenecks, and maintain system stability under load.
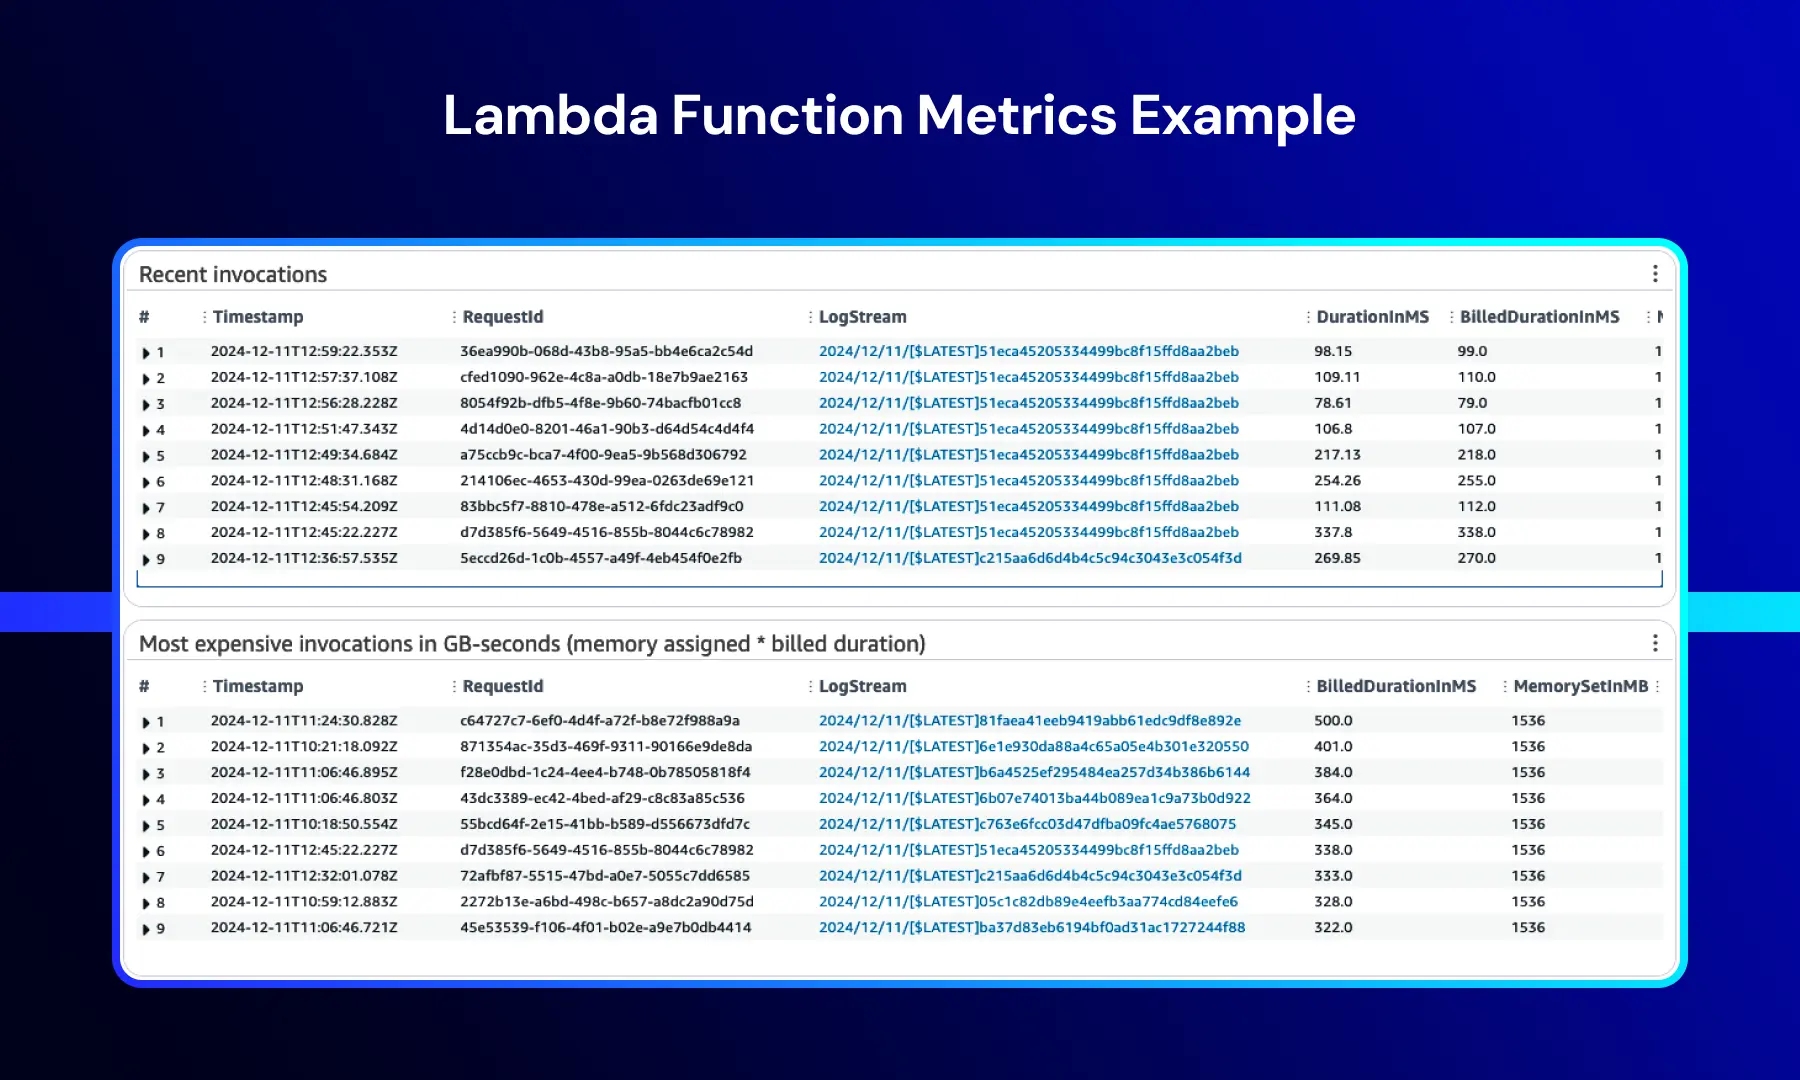
Lambda Function Metrics
This dashboard focuses on detailed performance metrics for AWS Lambda functions.
Key insights include:
- Most expensive invocations — identifying functions with the highest resource consumption
- Execution duration vs billed duration — understanding cost behavior based on AWS billing rules
- Access to detailed logs — enabling fast debugging and performance optimization
This level of visibility is critical for optimizing both performance and infrastructure costs in event-driven healthcare systems.
![Cloud Software Development [AWS].webp](/static/Cloud_Software_Development_AWS_a351611d38.webp)
Benefits of AWS CloudWatch for Healthcare
CloudWatch provides healthcare systems with the visibility and control required to maintain performance, reliability, and security in complex, real-time environments.
Key benefits include:
Full observability across systems
CloudWatch enables end-to-end healthcare observability across APIs, databases, infrastructure, and connected medical devices, allowing teams to understand system behavior in real time and quickly identify anomalies.
Faster incident response
Automated alerts and real-time monitoring reduce response time, helping teams detect and resolve issues before they impact clinical workflows or patient care.
Reduced downtime
Early detection of anomalies and automated recovery actions minimize service interruptions in critical healthcare systems.
Improved operational efficiency
Clear visibility into system performance allows teams to optimize resource usage and maintain stable system behavior under varying load conditions.
Enhanced compliance and security
Continuous monitoring and logging support audit requirements and help detect unauthorized access or unusual system activity.
Scalability
CloudWatch scales with system growth, supporting increasing data volumes, users, and connected devices without loss of visibility.
Is It Possible to Not Use CloudWatch?
Yes, alternatives to CloudWatch exist, and in some cases, they may be more suitable depending on system architecture and team preferences.
Common alternatives include:
- Datadog — offers advanced monitoring capabilities with a strong user interface and rich visualization tools
- Prometheus + Grafana — open-source solution that provides flexible metric collection and visualization, often used in custom or multi-cloud environments
- Elastic Stack (ELK) — focused on centralized log management and search capabilities
- New Relic — provides full-stack observability with strong support for application performance monitoring
However, the choice largely depends on how tightly your system is integrated with AWS.
Comparison Overview
| Tool | Key Advantage | Trade-offs |
|---|---|---|
| Datadog | Better UI and user experience | Higher cost at scale |
| Prometheus | Highly flexible and customizable | Complex setup and maintenance |
| CloudWatch | Best fit for AWS-native systems | Limited flexibility outside AWS |
CloudWatch remains a practical choice for AWS-based healthcare systems due to its native integration, lower operational overhead, and seamless scalability.
For teams operating fully within AWS, it reduces the need for additional tools and simplifies monitoring architecture without compromising visibility or control.
Implementation Steps for AWS CloudWatch
Implementing CloudWatch in healthcare systems requires not only proper setup but also a structured approach to avoid common pitfalls that can impact performance, costs, and reliability.
1. Set Up Monitoring
Enable CloudWatch for all relevant AWS services and define the key metrics that reflect system health and performance.
- Configure monitoring for APIs, databases, compute services, and integrations
- Install CloudWatch Agents where needed (e.g., for custom servers)
- Focus on critical metrics such as latency, error rates, and system load
Best practice:
Start with a minimal but meaningful set of metrics tied to real system risks (e.g., API latency, failed requests, data delays).
What not to do:
Avoid tracking too many metrics from the start — this creates noise, increases costs, and makes it harder to identify real issues.
2. Configure Dashboards and Alerts
Create dashboards and alerts that reflect real operational priorities rather than generic system metrics.
- Build dashboards for key workflows (e.g., patient data flow, API performance)
- Set alerts for latency, error rates, and abnormal system behavior
- Define thresholds based on real system usage, not assumptions
Best practice:
Align alerts with business-critical scenarios, such as delayed access to patient records or failed data delivery.
What not to do:
Avoid overly sensitive alerts or poorly defined thresholds — this leads to alert fatigue and ignored notifications.
3. Automate Responses
Use CloudWatch integrations to automate system reactions to incidents.
- Trigger AWS Lambda functions for retries, scaling, or recovery actions
- Configure auto-scaling based on load and performance metrics
- Integrate notifications with incident management tools
Best practice:
Automate responses for predictable failures (e.g., retries for transient errors, scaling during traffic spikes).
What not to do:
Do not rely entirely on manual intervention — in healthcare systems, delayed responses can directly impact system reliability.
4. Test and Optimize Continuously
Monitoring is not a one-time setup — it requires regular testing and optimization.
- Validate that alerts trigger correctly
- Simulate failure scenarios (e.g., API downtime, data delays)
- Regularly review and adjust thresholds, metrics, and alert logic
Best practice:
Continuously refine monitoring based on real incidents and system behavior.
What not to do:
Avoid a “set and forget” approach — outdated configurations often miss critical issues or generate irrelevant alerts.
Conclusion
AWS CloudWatch is a practical choice for healthcare system monitoring in AWS environments, providing the visibility, alerting, and cost control required for production environments.
In complex healthcare architectures, where multiple services, integrations, and real-time data flows must operate reliably, CloudWatch enables teams to maintain stability, detect issues early, and respond without delay.
When implemented correctly, it supports full observability, faster incident response, and more predictable system behavior under load.
As healthcare systems continue to scale and become more data-driven, having a well-defined monitoring and alerting strategy is no longer optional — it is a core part of building reliable and maintainable software.
If you are designing or scaling a healthcare platform on AWS, a well-configured CloudWatch setup can significantly reduce operational risks and improve system performance.
Need help implementing CloudWatch in your healthcare project?
At JetBase, we help healthcare teams design monitoring systems that go beyond basic setup — focusing on reliability, cost efficiency, and real-world performance.
Whether you are building a new platform or optimizing an existing one, we can help you set up a monitoring strategy that fits your architecture and business goals.
Contact us to discuss your project or get a consultation.